
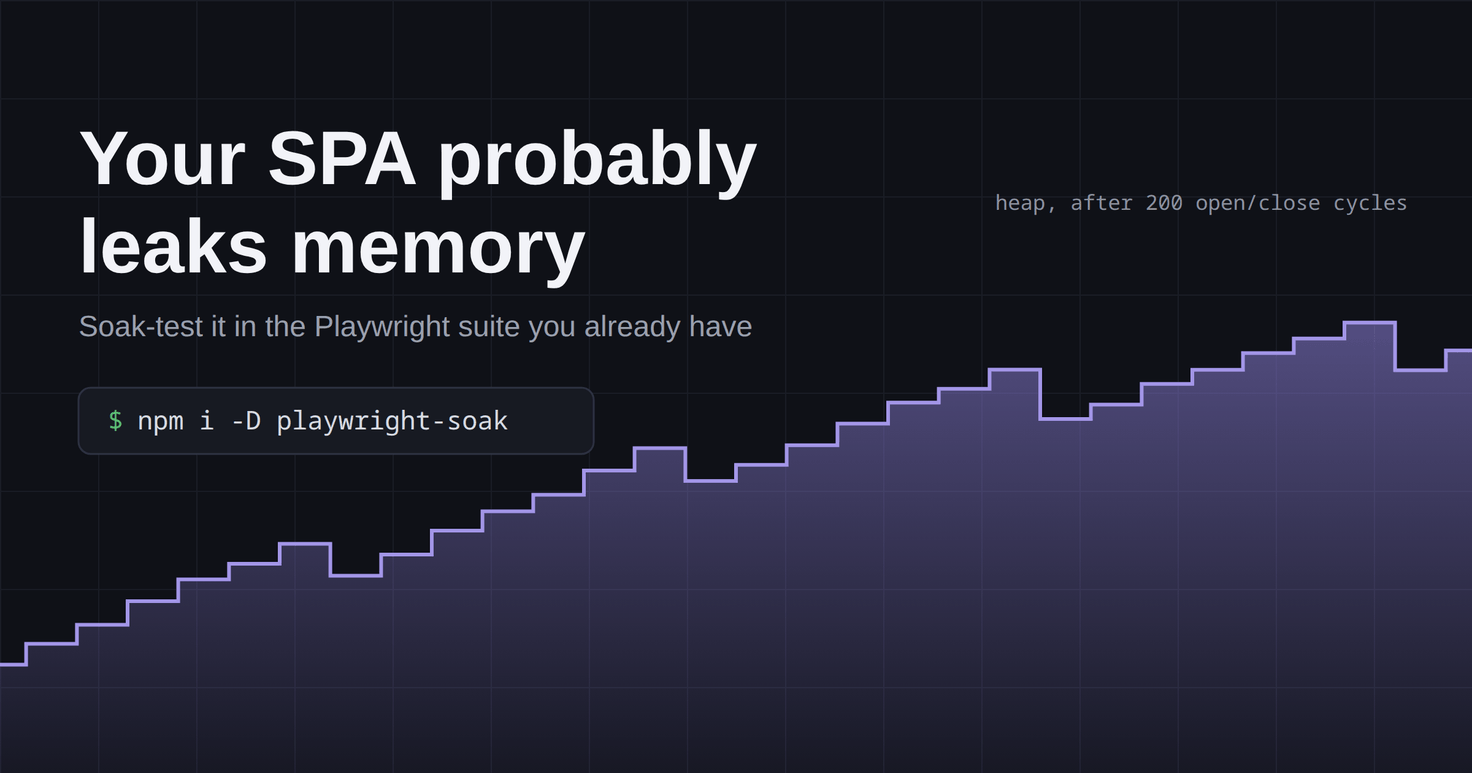
Your SPA probably leaks memory. Your Playwright suite can catch it
- Playwright
- Testing
- Memory leaks
- Performance
- Open source
[soak] drawer — 80 iterations
    base     heap   2.83MB  nodes    675  listeners   163  docs 1
    @   40   heap   3.50MB  nodes   5675  listeners   163  docs 1
    @   80   heap   4.18MB  nodes  10675  listeners   163  docs 1
    delta  heap +1.36MB  nodes +10000  listeners +0  docs +0
    per-iteration  heap 17.35KB  nodes 125.00
    nodes  ++++++++  +10000 total, biggest stretch 13% of it (spread out, so accumulating)
That’s a memory leak failing a CI build. Playwright doesn’t do this out of the box, and memory is a blind spot for e2e suites in general: here a store subscriber outlives the drawer it closes over, every open/close cycle keeps 125 DOM nodes alive, and the tests stay green the whole time. In development you never notice this stuff, you reload the page every few minutes anyway. The person who notices is the one with your app in a pinned tab since morning.
Recently I read Den Odell’s Your SPA is leaking memory — soak test it and the framing stuck with me: stop hunting leaks with a profiler after someone complains, catch them in CI like any other regression. I liked it enough to turn it into a package. playwright-soak runs inside the Playwright suite you already have. You give it a flow, say open a drawer and close it, and it repeats that flow a few hundred times with forced garbage collection in between, and fails the test if memory keeps piling up.
npm install -D playwright-soakThe bug that always ships
The leaks worth chasing are the small ones that repeat per interaction. A one-time allocation costs you a few megabytes and nobody cares. A subscriber that’s recreated on every drawer open, or a listener added without a matching removal, grows without bound. And it survives code review easily, because the bug is a missing line, not a wrong one.
Nothing in a typical pipeline catches it either. Unit and e2e tests run a flow once, and Lighthouse only ever sees a fresh page load. Profiling in DevTools would show it, but someone has to remember to do that, and nobody profiles the drawer they just refactored. So the leak ships and comes back weeks later as a vague complaint that the app “gets slow after a while”. In the Performance Monitor the complaint looks like this:
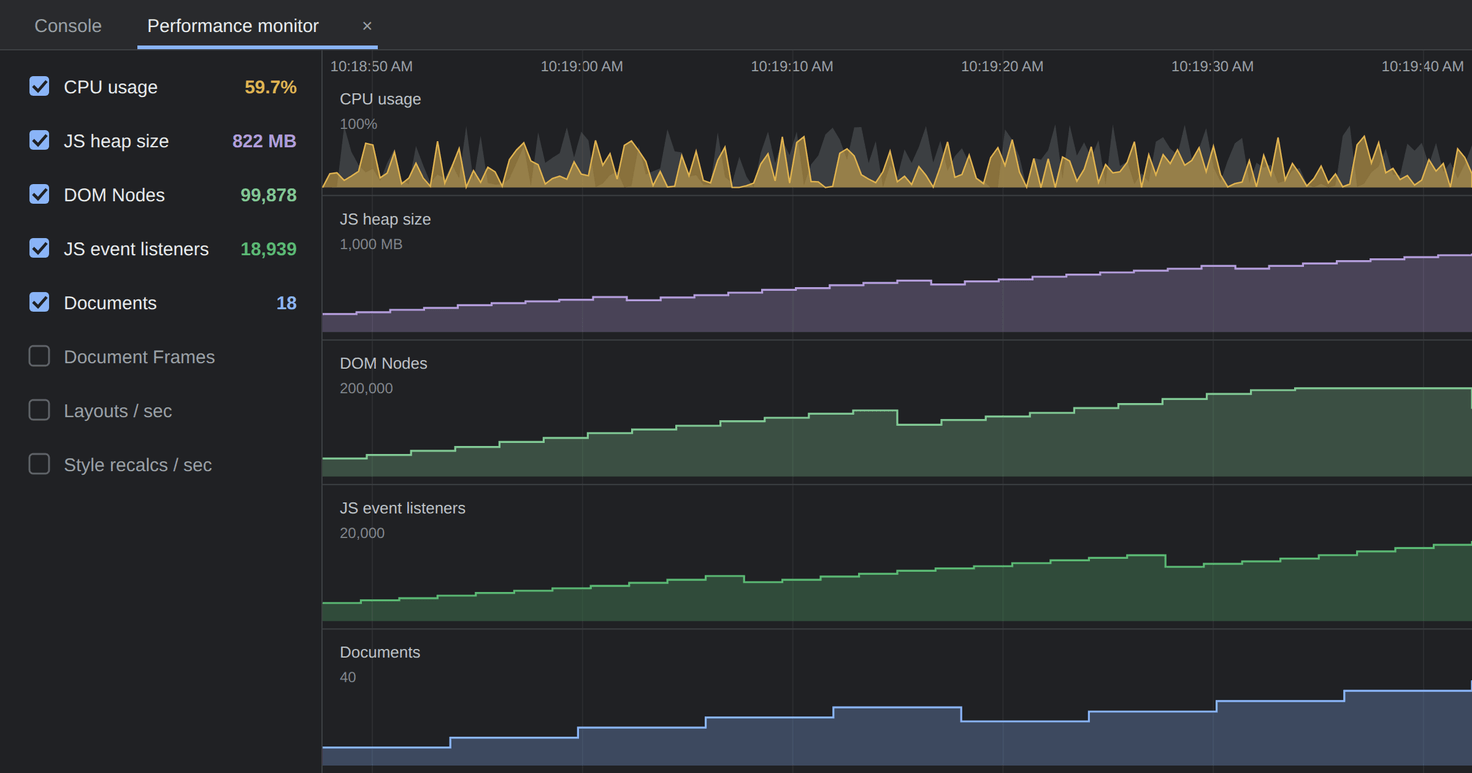
The fix is boring on purpose: make leak detection a test, so it runs on every PR whether anyone remembers or not.
Why the obvious test doesn’t work
If you’ve tried to write that test before, you probably measured the heap before and after the flow and asserted the difference is small. I started there too. It fails in both directions.
It flags healthy apps, because plenty of legitimate allocation happens once and stays: a cache filling up on first use, a global listener registered on first interaction. And it trips over the browser having a life of its own. In one clean run I watched Chromium register an extra listener around iteration 50 and drop it again before iteration 75. Land that blip on your final reading and the build fails over a listener the browser itself was about to remove. Tests like that get deleted within a month, which I suspect is why most teams don’t guard against leaks at all.
Two numbers can’t tell “grew once” apart from “grows every time”, so playwright-soak takes readings all the way through and judges the shape instead. A leak repeats, which means its growth spreads evenly across the run. Caches and browser blips pile all of theirs into one moment. This gets counterintuitive: a flow that ends +2 listeners can pass while one that ends +4 fails, because the pattern matters and the size doesn’t:
listeners ·+·····+·  +2 total, growth piled in one spot (a one-off step, passes)
listeners ·+·+·+·+·  +4 total, growth spread across the run (accumulating, fails)
That’s what makes it stable enough to gate a PR.
What a run looks like
import { test } from "@playwright/test";
import { attachCDP, expectNoLeak, formatSoak, soak } from "playwright-soak";

test("opening and closing the drawer does not leak", async ({ page }) => {
  await page.goto("/dashboard");

  const client = await attachCDP(page);
  const result = await soak({
    client,
    flow: async () => {
      await page.getByRole("button", { name: "Open" }).click();
      await page.getByRole("button", { name: "Close" }).click();
    },
  });

  console.log(formatSoak("drawer", result));
  expectNoLeak(result);
});
soak warms up first (so one-time allocation lands before the baseline), then runs the flow 200 times with readings every 25 iterations. Each reading covers four counters, and each catches a different kind of leak:
| signal | catches |
|---|---|
nodes | detached DOM kept alive by a closure, a cache or a stale ref |
listeners | handlers added without a matching removal |
documents | iframes that mount per interaction and never unmount |
heap | everything else: closures, growing arrays, unbounded caches |
The last row matters more than it looks. A stale callback that closes over a component tree, or an in-memory log nobody bounds, moves zero nodes and zero listeners. Only the heap gives it away, so expectNoLeak also checks the heap curve: a real leak keeps climbing at the same rate all run, while warm-up allocation flattens out.
Typing flows aren’t flaky, they’re billed
Chromium keeps roughly one DOM node per text-editing gesture. That’s the browser’s own bookkeeping, not your framework; a bare document.createElement('input') bound to nothing shows the same growth. Type a five-letter word 200 times and that’s a thousand nodes of pure browser overhead sitting on top of whatever your app does. It looks exactly like a leak. No wonder typing soak tests have a reputation for flakiness.
So the package measures the browser’s own rate against a throwaway control input and budgets for it:
const typingCost = await calibrateTypingCost(page, client, type);
const result = await soak({ client, flow: () => type(page.locator("#name")) });

expectNoLeak(result, { typingCost });
With that budget in place, typing flows are as stable as click flows.
Smoke alarm, not debugger
playwright-soak tells you that a flow accumulates memory, and which flow. It does not tell you which object leaked or what’s retaining it. That job belongs to memlab, which diffs heap snapshots and gives you actual retainer paths, but is Puppeteer-only and heavy enough that nobody runs it on every PR.
In practice you want both: soak tests on every PR, memlab when one of them goes red and you need to know what’s actually holding the memory.
Try it
If you have a Playwright suite and an app people keep open all day, write one soak test for your most-used flow and see what comes back.
npm install -D playwright-soakNo runtime dependencies. Chromium only, since the readings come from the Chrome DevTools Protocol. The repo ships a small example app where every kind of leak has a matched broken/fixed pair of tests, and a set of TanStack Intent skills so a coding agent can write these tests for you. The source is on GitHub, MIT licensed. If it catches something in your app, or misses something it shouldn’t have, open an issue, I want to know. And a star on the repo is the easiest way to help the next person find it.
Comments
Sign in with GitHub to leave one. Threads are public GitHub Discussions — you can read and reply from there instead.
Loading comments…